Use case 69 · Enterprise
Levelbuild construction intelligence
Connect construction project data, predictive signals, and customer sentiment for earlier action.
levelbuild
Published by Google Cloud
levelbuild cuts database costs 50% and brings predictive and sentiment analysis to construction firms
The published Google Cloud customer story documents levelbuild's use of connected data, AI, and workflow design in this domain.
- The customer story reports lower database cost and predictive and sentiment analysis for construction firms.
- The example is treated as evidence of a design pattern, not a promise that every deployment will reproduce the same result.
Workflow at a glance
See the orchestration path before exploring the operating detail.
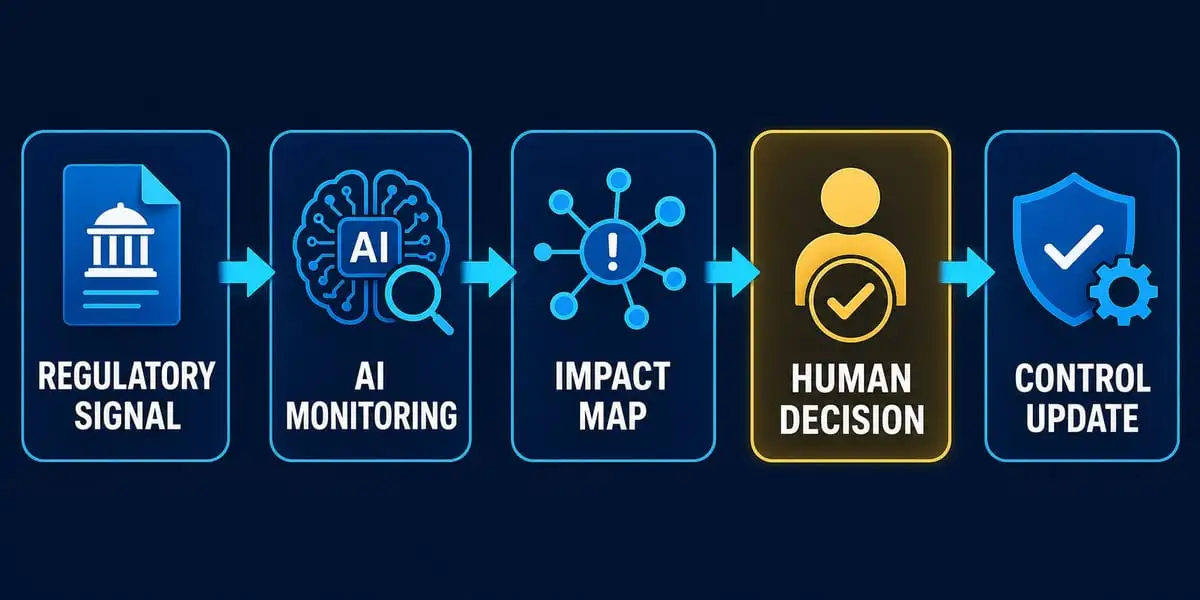
This domain view shows where AI accelerates the work and where accountable human judgment remains in command.
The business problem
Orchestration redesigns the whole operating loop.
Construction teams need to see schedule, cost, project, and customer signals together before small issues become claims or delays.
levelbuild is a public proof point for the pattern. The transferable lesson is the operating design: a project intelligence workflow can turn fragmented operational data into prioritized action for project owners.
Orchestration corridor
How the work moves from signal to accountable outcome.
Every step has a defined input, intelligence task, action, and handoff. This is what separates an operating system from an isolated prompt.
-
01
Frame the demand
Define the business signal, Project progress, cost, schedule, and sentiment, and the outcome that matters.
-
02
Assemble context
Connect approved records, knowledge, and construction records, customer communications, and project systems before the model acts.
-
03
Coordinate the work
Use AI to predict risk, summarize status, and prioritize intervention, then route uncertainty to the accountable owner.
-
04
Execute with limits
Move the permitted task through existing systems while preserving project-owner review, commercial authority, and source traceability.
-
05
Measure the result
Track time to project-risk intervention, quality, exceptions, and the effect on the wider ecosystem.
Ecosystem command map
The capability lives between systems, not inside one model.
The four quadrants show the assets that must be coordinated. Select any quadrant to emphasize its role in the operating system.
Signals
What enters the system
- Project progress, cost, schedule, and sentiment
- construction records, customer communications, and project systems
- Outcome, urgency, and exception signals
Intelligence
What AI organizes
- predict risk, summarize status, and prioritize intervention
- Evidence retrieval and prioritization
- Pattern, risk, and confidence analysis
Actions
What the workflow moves
- Prepare the next best action
- Route, draft, or update the authorized system
- Escalate the consequential exception
Human command
Where authority remains
- Business owner sets the objective
- Subject-matter expert validates the decision
- Risk and data owners monitor the boundary
Value and control instrument panel
Measure the business result and the integrity of the route.
The bars are not performance claims. They show the measurement sequence: establish the current baseline, agree a pilot threshold, and verify the observed result.
time to project-risk intervention
Baseline the current time to project-risk intervention and compare the assisted path with the existing process.
Establish baseline → set pilot threshold → verify outcomeQuality at handoff
Measure whether the human owner receives complete, relevant, and traceable context.
Establish baseline → set pilot threshold → verify outcomeException rate
Track uncertainty, rework, escalation, and failure by workflow segment.
Establish baseline → set pilot threshold → verify outcomeBusiness outcome
Connect the workflow change to more useful construction intelligence at lower infrastructure cost, not just model activity.
Establish baseline → set pilot threshold → verify outcome90-day implementation route
Move from reconnaissance to controlled scale.
Select a phase to inspect its executive decision gate.
Phase 1
Recon
Map the current levelbuild construction intelligence workflow, owners, evidence, systems, and failure modes.
- Executive owner
- Chief Operating Officer
- Decision gate
- Problem and baseline confirmed
Phase 2
Pilot
Run one bounded workflow with the current process as a comparison and make time to project-risk intervention visible.
- Executive owner
- Chief Operating Officer
- Decision gate
- Value and control thresholds met
Phase 3
Scale
Expand only after quality, control, adoption, and ecosystem effects are accepted by the operating owner.
- Executive owner
- Chief Operating Officer
- Decision gate
- Operating owner accepts scale
Source and governance discipline
Evidence first. Claims qualified. Accountability designed in.
This operating play is an independent synthesis by Dr. Alejandro Canonero, DBA. It translates a documented implementation into a vendor-neutral business design and applies the War of the Ecosystems perspective. It does not imply endorsement by the source organization.
Executive working session
Apply this pattern to your enterprise workflow.
A focused diagnosis will map the current work, quantify the opportunity, define human command, and shape the first controlled pilot.